
Growth and Value Performance after Recessions
Growth and Value Performance after Recessions
During a recession, the stock market can lose significant value. This could have a large impact on portfolio returns. Predicting the duration and extent of recessionary periods is almost impossible. History shows that value stocks tended to maintain more of their value relative to growth stocks during market downturns and were likely to prosper after the downturn had ended.
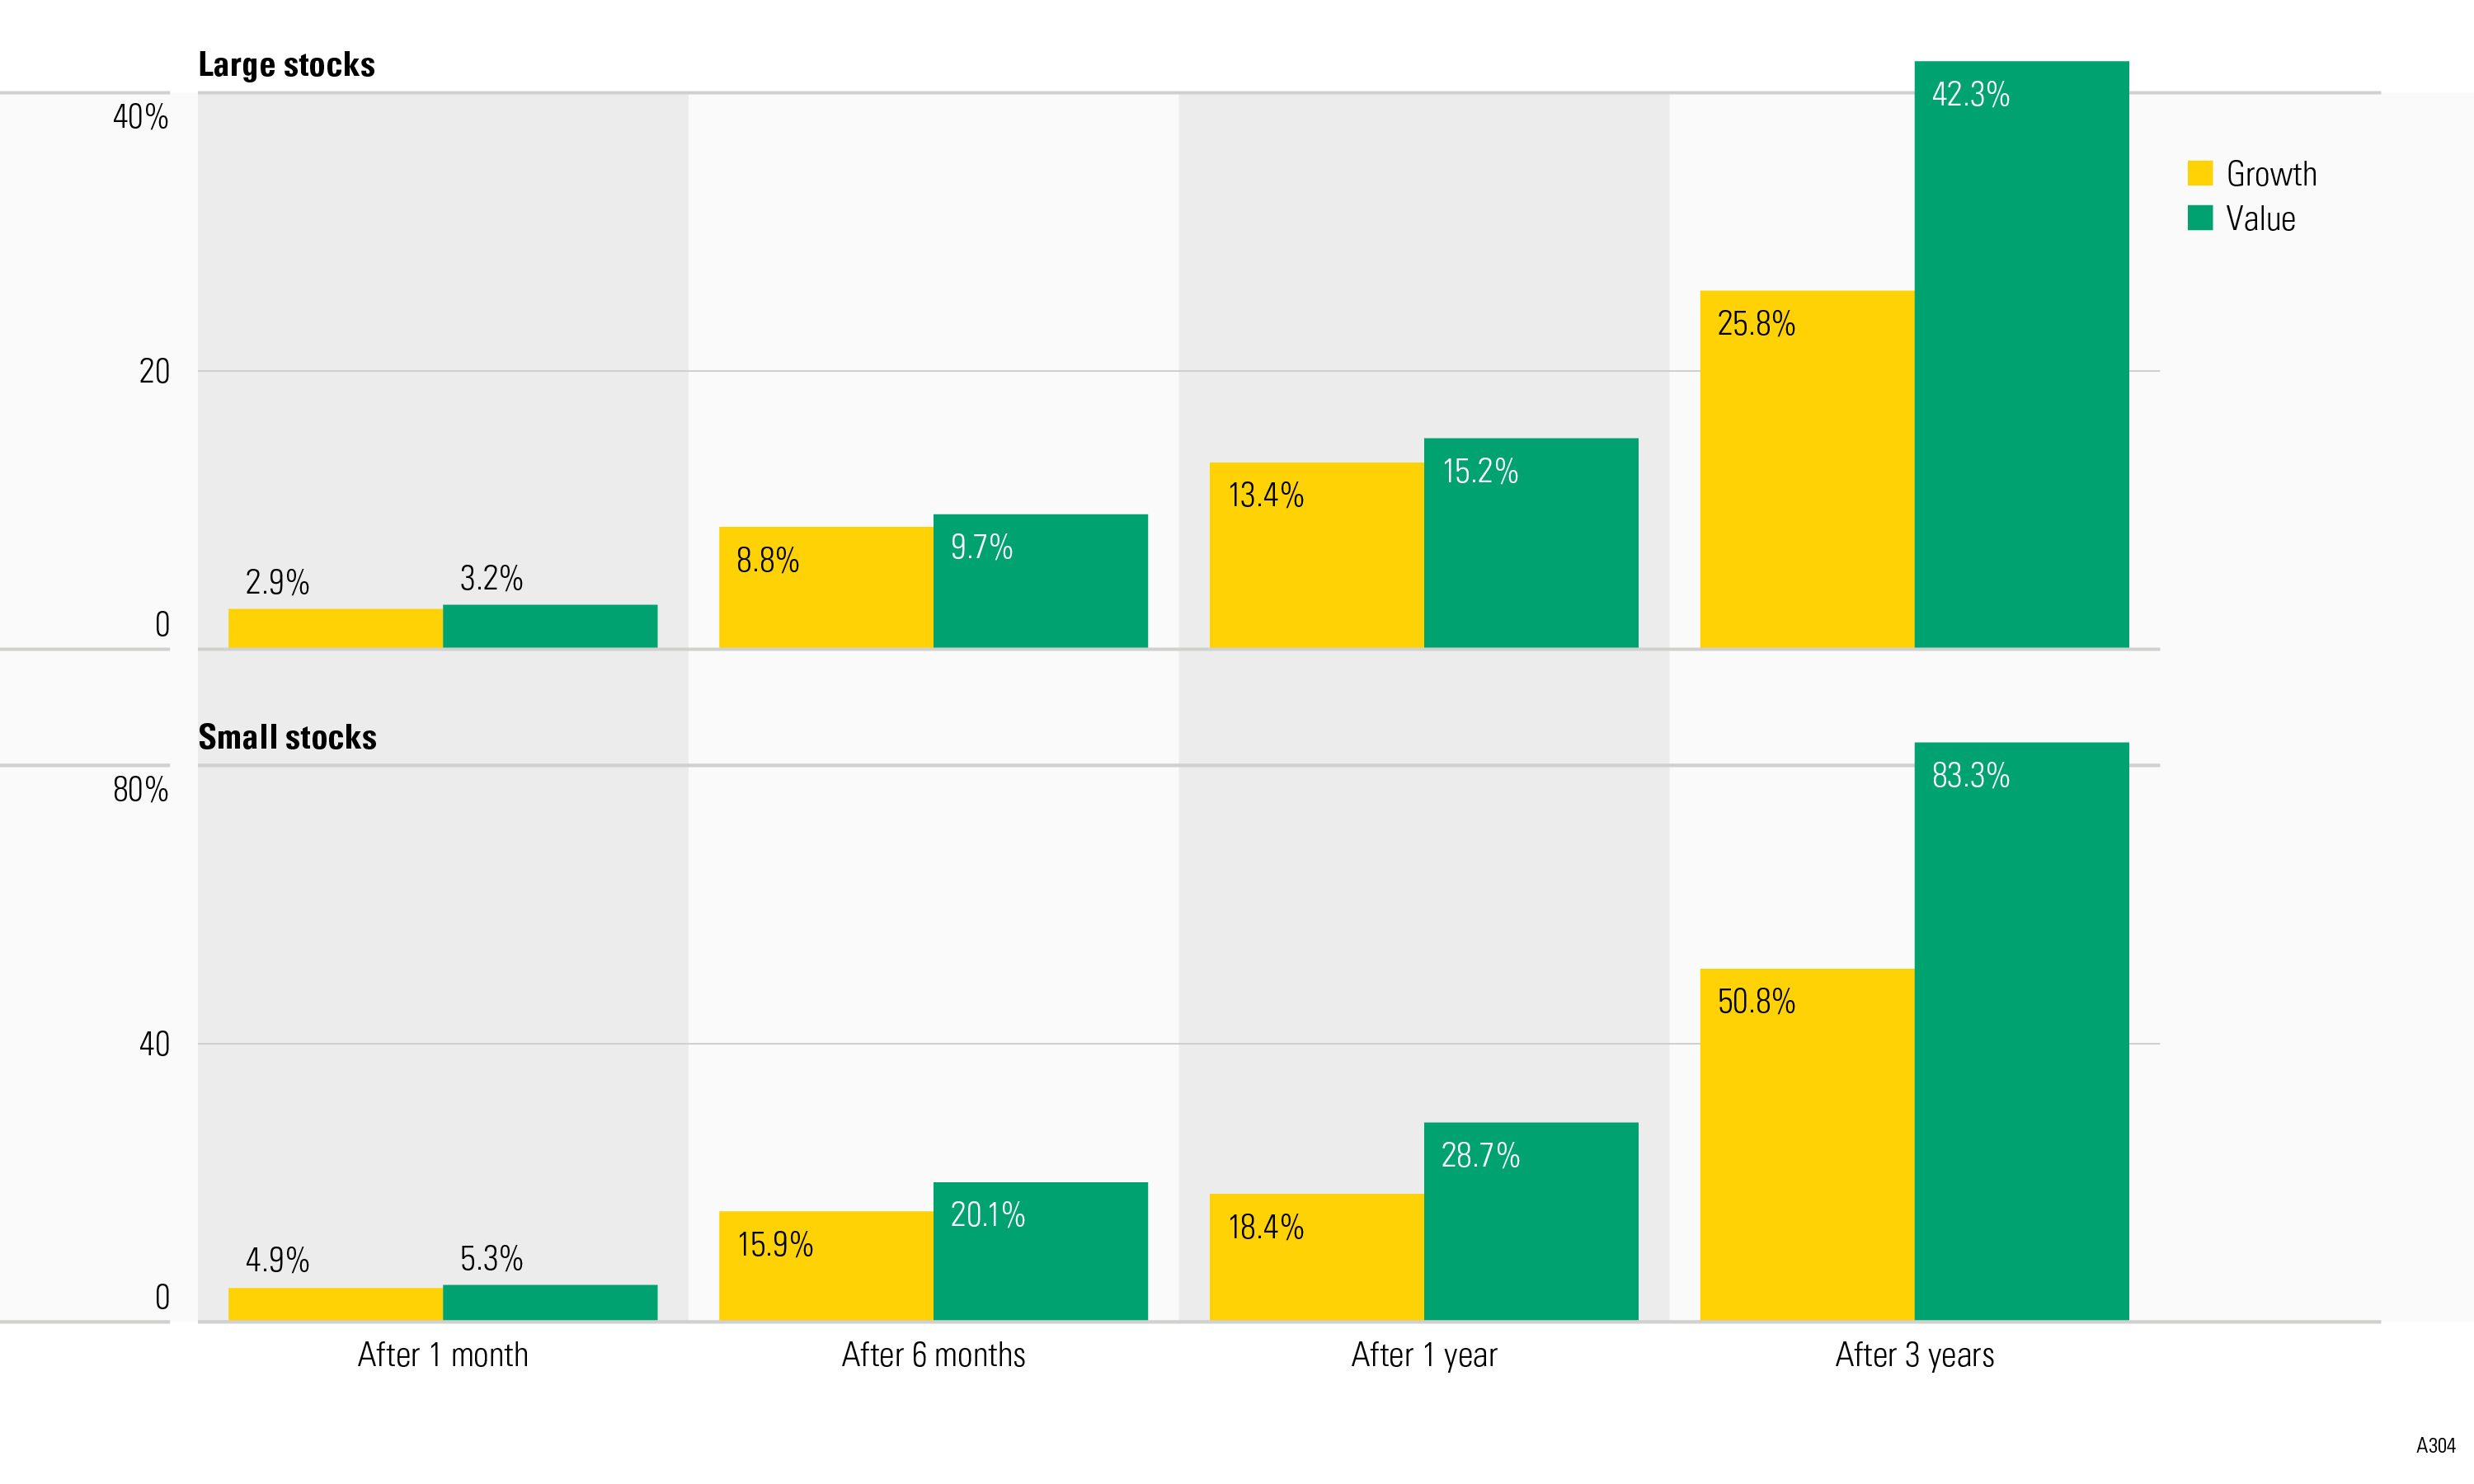
Value stocks have higher dividend yields and higher underlying asset value relative to their market value compared with growth stocks. The image above illustrates that, on average, the cumulative returns of value stocks outperformed those of growth stocks one month, six months, one year, and three years after the end of a recession. Investing in value stocks may help lessen the impact of a recession on investors’ portfolios and may put portfolios in a good position to earn gains when the market is coming out of a recession.
Things To Know
- Diversifying into small stocks may benefit investor portfolios, especially when the market is coming out of a recession.
Small stocks can be strong performers
The image also shows that small stocks have been stronger performers after recessions when compared with large stocks. Many investors fear the volatility of small stocks. Their fears, however, may not justify overlooking the potential of this asset class. Diversifying into small stocks, namely small-value stocks, may benefit investor portfolios, especially when the market is coming out of a recession.
The limits of diversification
Diversification does not eliminate the risk of experiencing investment losses. Returns and principal invested in stocks are not guaranteed, and stocks have been more volatile than other asset classes. Furthermore, small stocks are more volatile than large stocks and are subject to significant price fluctuations and business risks, and are thinly traded.
Although value stocks have outperformed growth stocks, please keep in mind that each type of stock carries unique risks that include, but are not limited to, economic risk, market risk, company risk, and strategy risk.
About the data
Growth and value stocks in this example are represented by the Ibbotson Associates Growth and Value Indexes for 1970–97 and the Morningstar Style Indexes thereafter. The Ibbotson Associates Growth and Value Indexes are calculated based on data from CRSP US Stock and Index Databases, the Center for Research in Security Prices (CRSP®), and the University of Chicago Booth School of Business. Used with permission. An investment cannot be made directly in an index.
Recession data is from the National Bureau of Economic Research (NBER). The average cumulative returns are calculated from the end of each of the last seven recessions in U.S. history (1969–2014). The eight recession periods considered herein (as defined by the NBER) are December 1969–November 1970; November 1973–March 1975; January 1980–July 1980; July 1981–November 1982; July 1990–March 1991; March 2001–November 2001; December 2007–June 2009; and February 2020–April 2020. The NBER does not define a recession in terms of two consecutive quarters of decline in real gross domestic product. Rather, a recession is a recurring period of decline in total output, income, employment, and trade usually lasting from six months to a year and is marked by widespread contractions in many sectors of the economy. The data assumes reinvestment of income and does not account for taxes or transaction costs.