
One-Year Growth and Value Cycles
One-Year Growth and Value Cycles
One major decision, when choosing among equities, is whether to buy growth- or value-oriented stocks.
This image illustrates the performance differential of growth and value stocks on a 12-month rolling basis. Rolling-period returns are a series of overlapping, contiguous periods of returns. For example, the first rolling period is Jan. 1, 1970 to Dec. 31, 1970; the second is Feb. 1, 1970 to Jan. 31, 1971; and so on. When the performance differential of value stocks is positive, value has outperformed growth; when the performance differential of growth stocks is positive, growth has outperformed value.
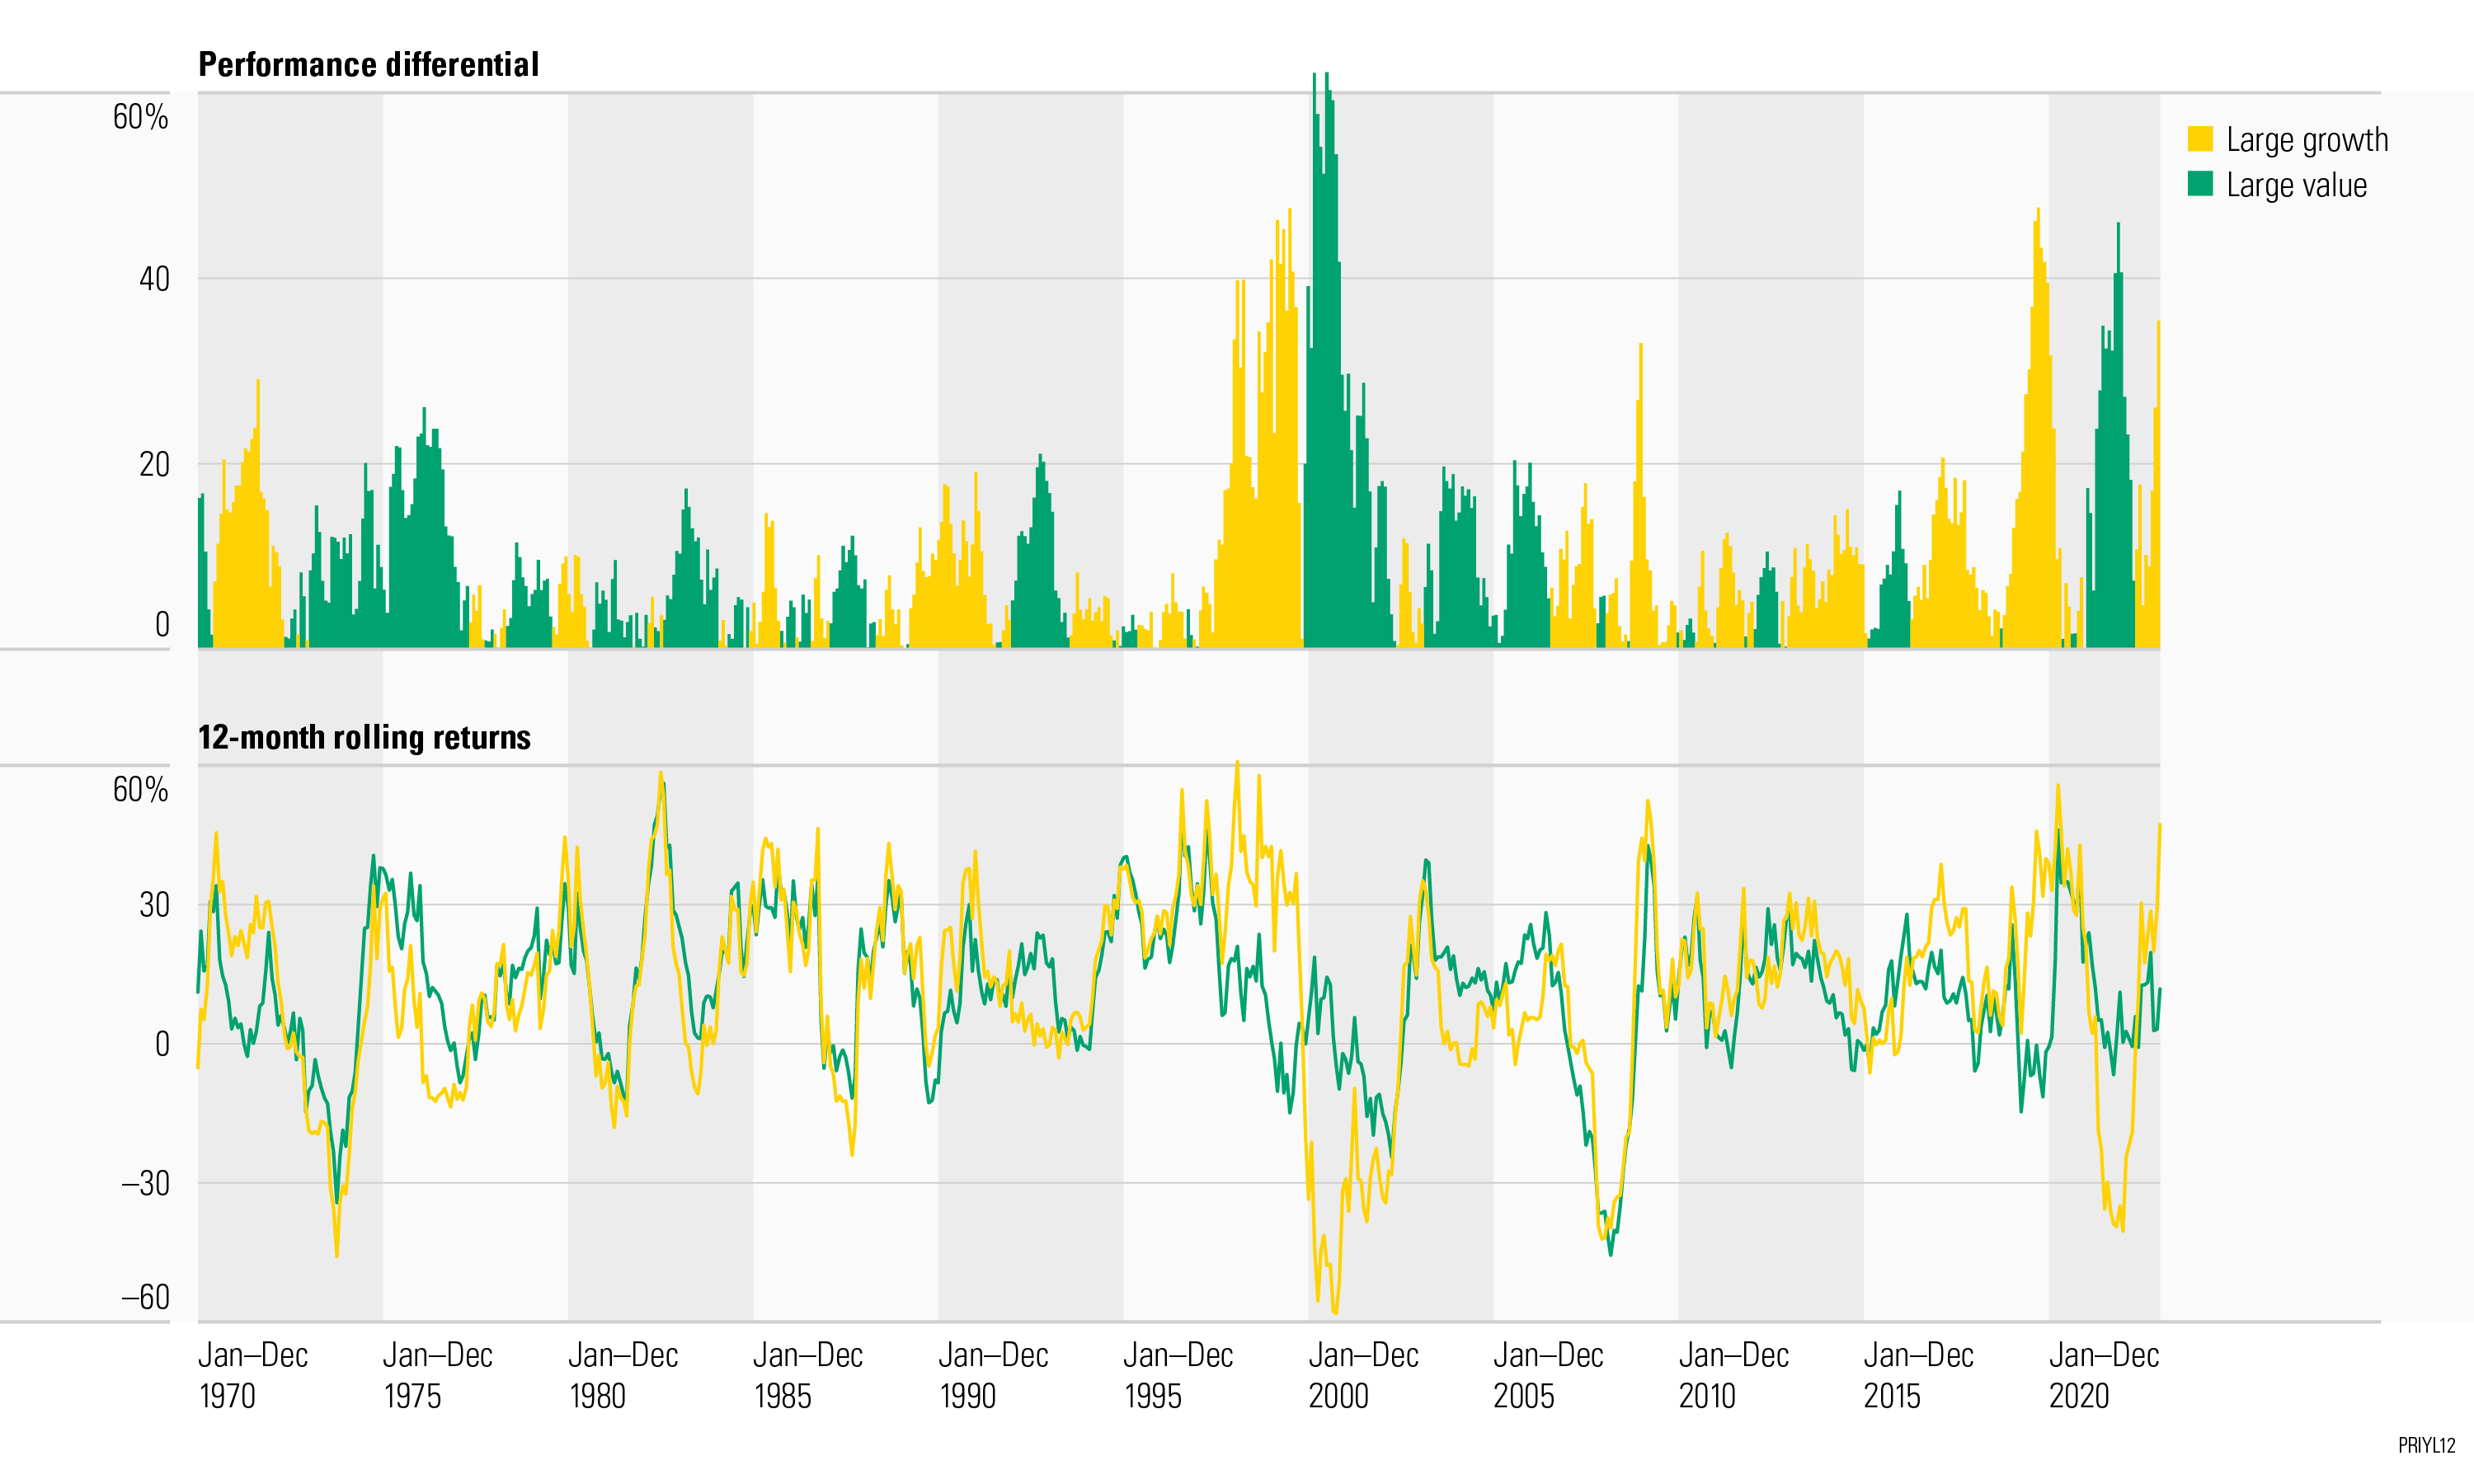
Historically, value stocks have outperformed growth stocks. However, this long-term trend does not mean investors should focus solely on value stocks. As the illustration shows, there have been extended periods when growth stocks have been in favor, such as the recent couple of years. To ensure a well-diversified portfolio, you should consider holding both growth and value stocks.
Know the risks
Returns and principal invested in stocks are not guaranteed.
Although value stocks have outperformed growth stocks, please keep in mind that each type of stock carries unique risks that include, but are not limited to, economic risk, market risk, company risk, and strategy risk.
About the data
Large-growth and large-value stocks in this example are represented by the Ibbotson Associates Growth and Value Indexes for 1970–97 and the Morningstar Style Indexes thereafter. The Ibbotson Associates Growth and Value Indexes are calculated based on data from the CRSP US Stock and Index Databases, the Center for Research in Security Prices (CRSP®), and the University of Chicago Booth School of Business. Used with permission. An investment cannot be made directly in an index. The data assumes reinvestment of income and does not account for transaction costs or taxes.