
Three-Year Growth and Value Cycles
Three-Year Growth and Value Cycles
Even over periods as long as three years, the performance of growth and value stocks can be highly variable. These shifts in leadership make it virtually impossible for investors to know in advance which style will be in favor over the upcoming three years.
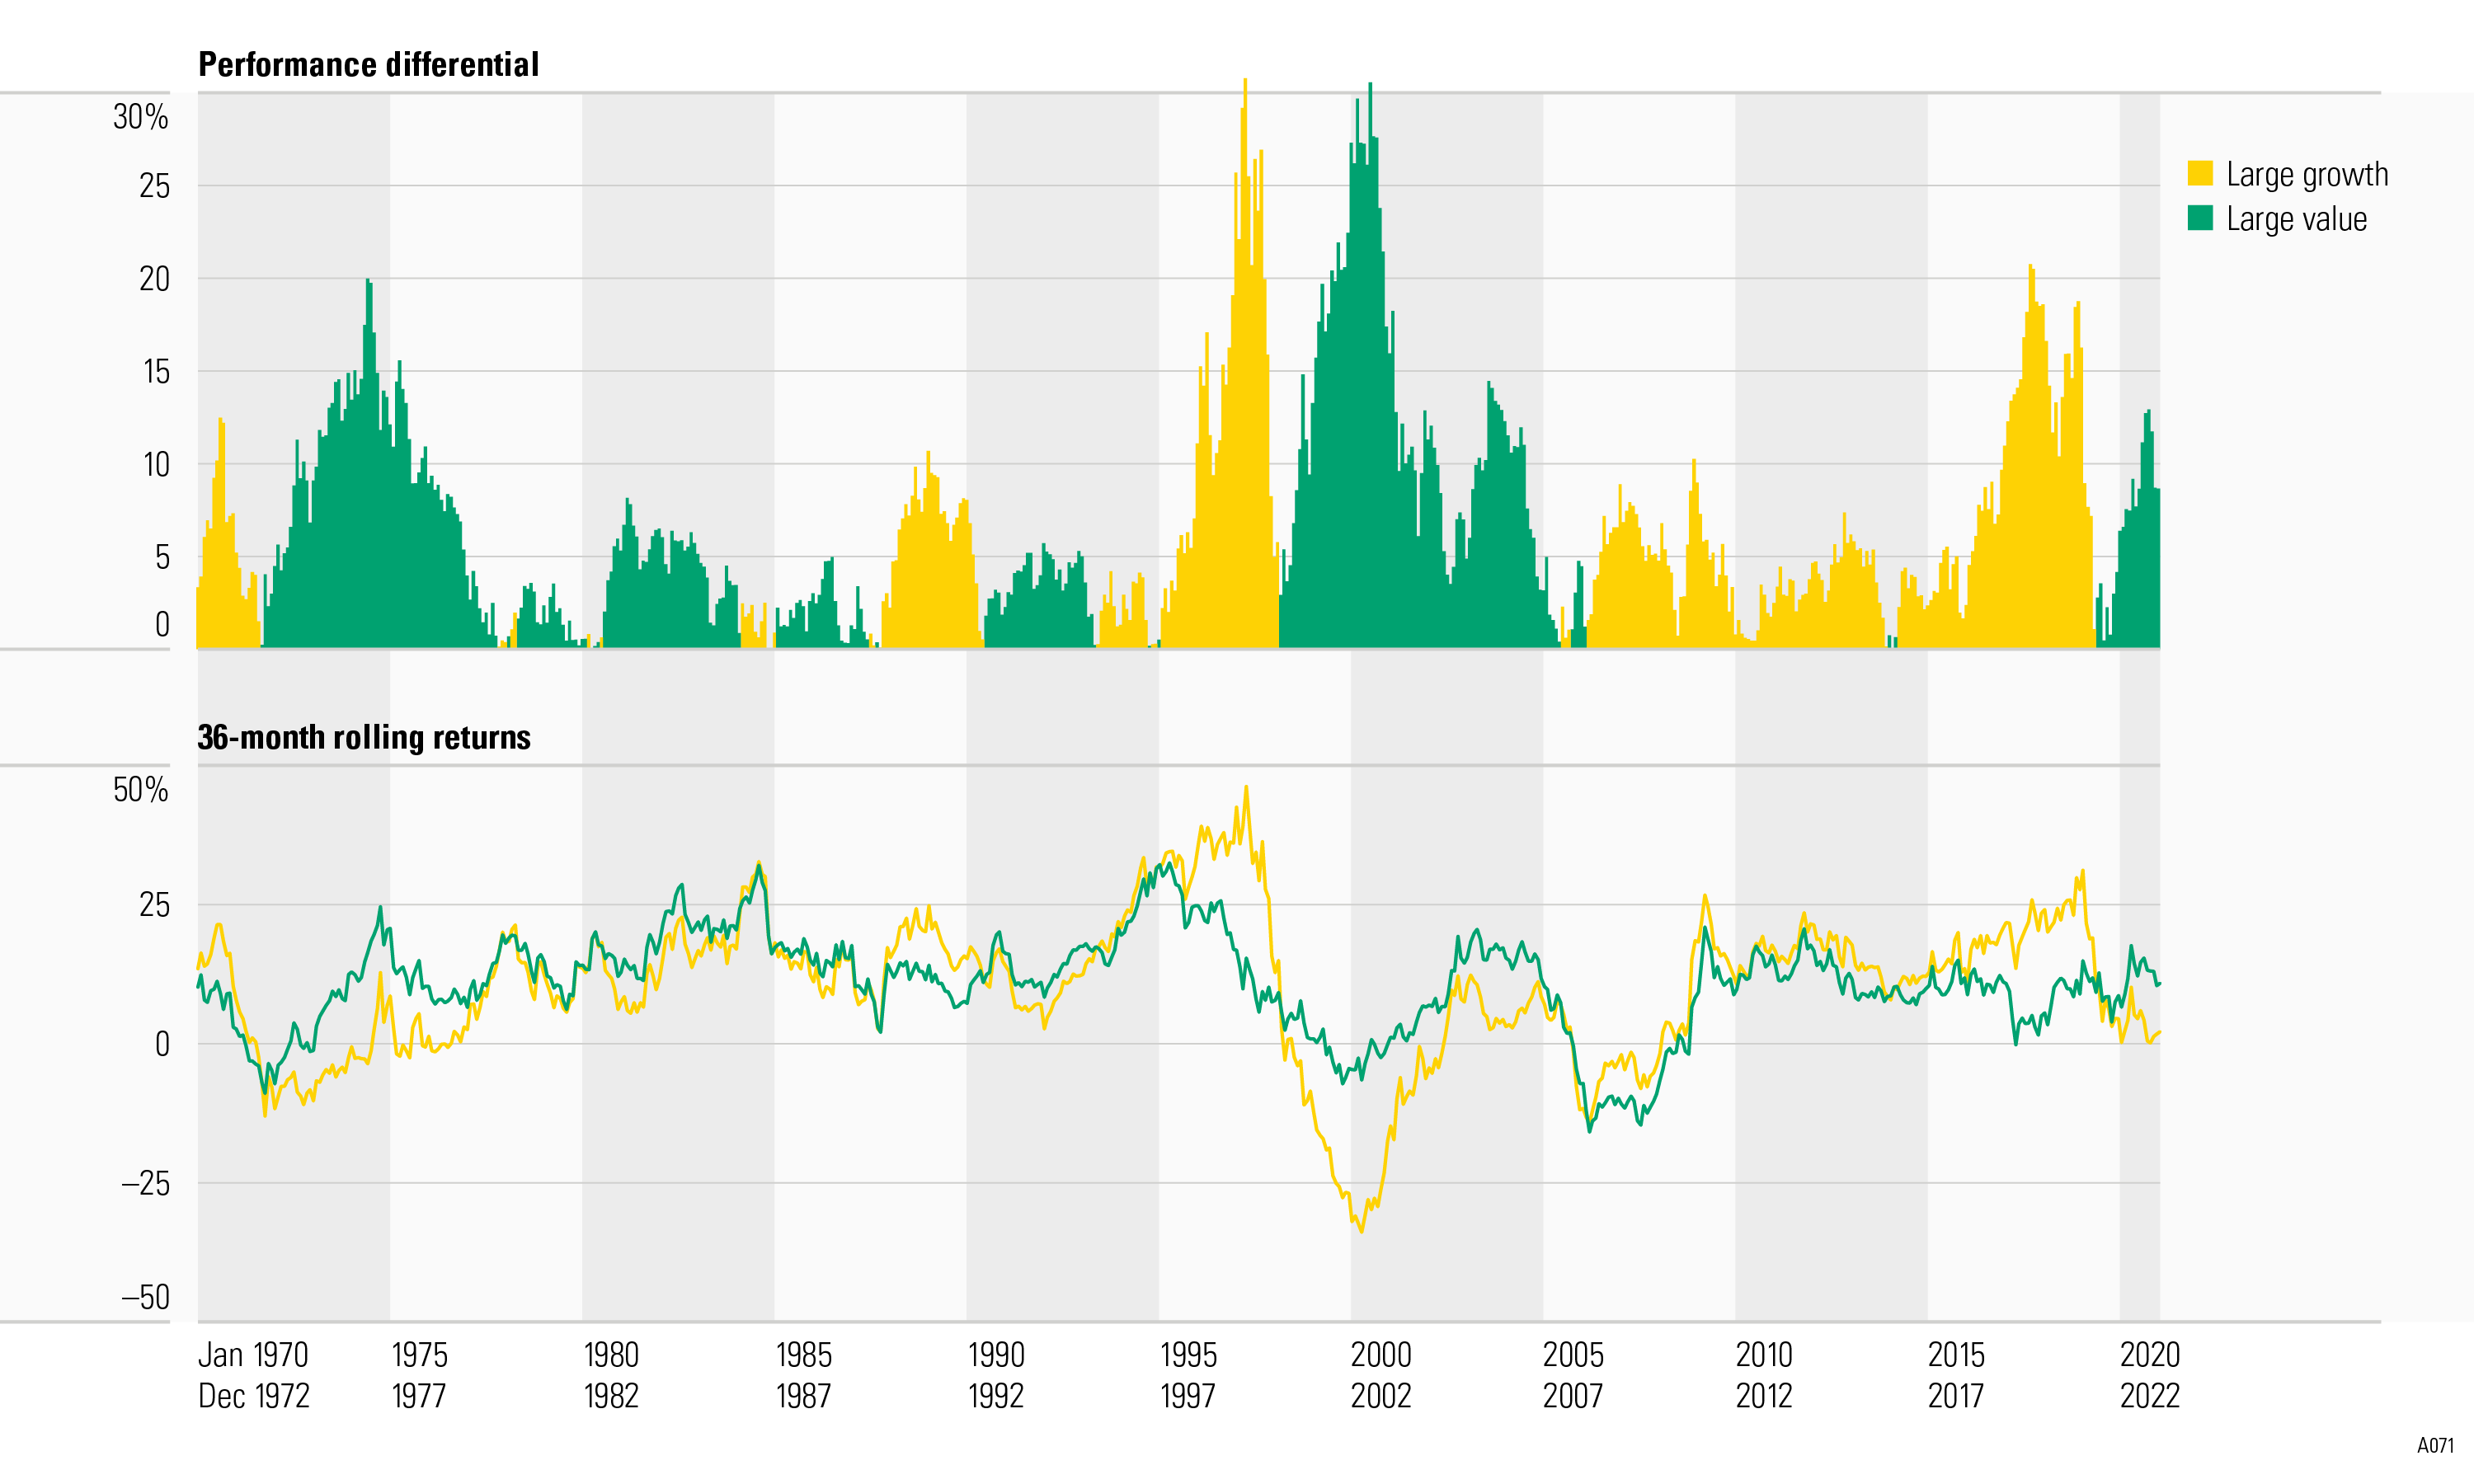
This image illustrates the performance differential of growth and value stocks on a 36-month rolling basis. Rolling-period returns are a series of overlapping, contiguous periods of returns. For example, the first rolling period is Jan. 1, 1970 to Dec. 31, 1972; the second is Feb. 1, 1970 to Jan. 31, 1973; and so on. Over most three-year periods since 1970, value stocks have outperformed growth stocks; however, since February 2009, growth stocks have consistently outperformed value stocks.
The alternating performance of growth and value stocks has been consistent over the time period analyzed. Most of the history of growth versus value investing has significantly favored value investing.
Know the risks of stocks
Returns and principal invested in stocks are not guaranteed.
Although value stocks have outperformed growth stocks, please keep in mind that each type of stock carries unique risks that include, but are not limited to, economic risk, market risk, company risk, and strategy risk.
About the data
Large-growth and large-value stocks in this example are represented by the Ibbotson Associates Growth and Value Indexes for 1970–97 and the Morningstar Style Indexes thereafter. The Ibbotson Associates Growth and Value Indexes are calculated based on data from the CRSP US Stock and Index Databases, the Center for Research in Security Prices (CRSP®), and the University of Chicago Booth School of Business. Used with permission. An investment cannot be made directly in an index. The data assumes reinvestment of income and does not account for transaction costs or taxes.